| Mines in the Illinois Portion of the Illinois-Kentucky Fluorspar District
|
|
| Series
|
Circular 604
|
| Author
|
F. Brett Denny, W. John Nelson, Jeremy R. Breeden, and Ross C. Lillie
|
| Date
|
2020
|
| Buy
|
Web page
|
| Report
|
PDF file
|
| Map
|
PDF file
|
Statistics on fluorspar and metal mining in Illinois from 1925 through 1985 are available in the Illinois Department of Natural Resources Illinois Coal Reports. Published annually, the Illinois Coal Reports document the short tons of raw or crude ore mined in Illinois by company. The crude ore mined is milled or refined before being sold; therefore, the crude ore figures are larger than the finished or refined tonnage of fluorspar shipped. The refined or finished tonnage of fluorspar is reported in the U.S. Geological Survey (USGS) Minerals Yearbooks.
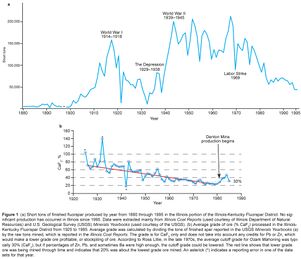
Available supply, demand, and economic conditions controlled the volume and sale price of fluorspar. The need for fluorspar increased during World Wars I and II and lessened during economic downturns, such as the Great Depression of the 1930s (Figure 1a). From 1925 to 1985, more than 125 individual companies produced fluorspar in Illinois, but the top 24 companies accounted for 97% of the total crude ore production in Illinois (Table 1). Changing ownership of mines and properties makes tracking fluorspar production by company difficult; thus, Table 1 provides only an estimate of raw fluorspar production. An asterisk in Table 1 indicates a discrepancy or error in the data related to that company. This could be due to typographical errors, erroneous data submitted by the mining company, or other human errors. Although the data have a few problems, the Illinois Coal Reports as a whole are an excellent source of raw production figures for the Illinois portion of the district.
The Illinois Coal Reports indicate that in 1925, seven companies were mining fluorspar in Illinois. In 1936, eleven companies reported production, and in 1941, twenty-nine companies were producing fluorspar ore. In 1946, twenty-three companies reported production. The number of companies producing ore in Illinois in 1955 decreased to ten, and by 1965, only five companies were producing ore. During the late 1970s, IKFD reserves and production continued to decline. The decline was also partly affected by competition from imported fluorspar from Mexico, China, and South Africa. In 1981, the Hastie Mining Company produced 2,404 tons of crude ore, the Inverness Mining Company produced 128,085 tons of crude ore at its Minerva Mine and 46,105 tons of crude ore at its Spivey Mine, and Ozark-Mahoning produced a combined total of 199,506 tons from several mines.
The single largest producer in the IKFD was Ozark-Mahoning and related companies. Ozark Mining began an exploration program in southern Illinois in 1937 and erected a mill in Rosiclare in 1939. In 1946, the Mahoning Mining Company and Ozark Chemical Company merged to form the Ozark-Mahoning Company (Evans and Hellier 1986). Ozark-Mahoning was acquired by Pennwalt in 1974 and operated as a subsidiary. Elf Atochem acquired Pennwalt in 1990, and Elf Atochem merged with Total Fina in 1999. This company was referred to as Ozark-Mahoning or simply Mahoning, even after the purchases and mergers. Ozark-Mahoning company files indicate the company produced more than 10 million tons of raw crude ore. The raw production estimate for Ozark-Mahoning in Table 1 has been supplemented by information contained in Ozark-Mahoning company scanned documents.
By comparing the raw tons in the Illinois Coal Reports with the refined and shipped tons in the USGS Minerals Yearbooks, we can estimate the average grade of the ore by year (Figure 1b). When compiling this publication, we noticed a few obvious errors in the statistics provided in the Illinois Coal Reports or USGS Minerals Yearbooks. In 1925 and 1932, the USGS Minerals Yearbooks reported more finished tons shipped than the Illinois Coal Reports reported raw tons being mined, which skews the ore grade above 100%. The Illinois Coal Reports cite no production for the S.C. Yingling Company in 1941, 809,857 raw tons in 1942, and 2,190 raw tons in 1943. The 1942 Yingling production of 800,000 tons far exceeds maximum annual output of the Rosiclare Mine, which Weller (1943f) identified as the largest fluorspar mine in the United States. We suggest Yingling produced significantly less than 800,000 tons. Except for 1942, Yingling never produced more than 8,000 raw tons. Subtraction of the anomalous production of Yingling in 1942 allows an average ore grade to fall more in line with the historical fluorspar grade during that time (Figure 1b). In 1976, the Illinois Coal Reports state that 189,975 tons was mined by Hastie Mining Company. In 1975, Hastie reported 4,591 raw tons, whereas in 1977, Hastie reported 1,751 raw tons. A conversation with Don Hastie, owner of Hastie Mining, indicated that Hastie Mining probably produced about 5,000 tons of spar during 1976 (Don Hastie, personal communication with Brett Denny, February 28, 2020). Illinois Minerals is listed as having produced fluorspar from 1977 to 1979. However, no corroborating information could be obtained concerning these mines. Eric Livingston, geologist with Ozark-Mahoning from the 1970s through the 1990s, could not remember any Illinois Minerals mining operations in southeastern Illinois (Eric Livingston, personal communication with Ross Lillie, March 2020). Illinois Minerals occupied an office in Alexander County, and amorphous silica (tripoli) production may be what was inaccurately reported as fluorspar production. The G.B. Mining Company also reported 69,745 tons of raw ore in 1949 but only 553 tons in 1948. These are the only 2 years of production from this company, and although the large tonnage produced in 1949 seems speculative, this tonnage is possible and is reported in Table 1.
In the late 1800s to early 1900s, only high-grade ore was mined, with little milling or processing being applied. The ore grade gradually decreased through time, partially because of the higher grade deposits being mined first. However, through time, as milling equipment and processing techniques improved, a lower grade ore could be mined profitably. Improved milling techniques allowed the concentration and enrichment of fluorspar as well as the concentration of secondary minerals such as lead, barite, and sphalerite, which could make a lower grade ore economic. Obviously, some mines contained higher grade material, and some lower grade ore was economic mainly because of secondary minerals. The USGS Minerals Yearbooks from 1925 to 1927 indicate an average ore grade of 50% to 60% CaF2 during that time period.
Ozark-Mahoning records indicate that by the end of 1969, the total raw production from the Hill-Ledford Mine was 792,848 raw tons at 23% CaF2 and 1.6% Zn, whereas the East and North Green Mines produced 355,243 tons of 31% CaF2 and 5% Zn. These data corroborate and align with the district average grade estimates contained in Figure 1b. Around 1981, Ozark-Mahoning opened the Denton Mine, which increased the ore grade for several years. The last two fluorspar mines operating in Illinois, Annabel Lee and Minerva No. 1, ceased production on November 29, 1995. Ozark-Mahoning records indicate that more than 900,000 tons was mined at both the Denton and Annabel Lee Mines. As of this report, the Hastie Mining and Trucking Company is producing a small amount of fluorspar at its limestone quarry operation at Cave-in-Rock, but no other production is ongoing in Illinois. However, mineral exploration programs have been active in this region during the last few years, and future fluorspar mining ventures in the IKFD are likely.
Several authors have previously reported the total tons of refined fluorspar sourced from the entire IKFD. In 1956, the USGS (1956) estimated the total fluorspar reserves of the IKFD as 8.1 million short tons of measured ore and 4 million tons of inferred ore. Grogan and Bradbury (1968) also estimated that 9.5 million tons of fluorspar had been mined since 1880. Trace (1976) determined that 7,402,334 tons had been mined in the Illinois portion of the IKFD and that 3,180,913 had been mined in the Kentucky portion of the IKFD through 1970. Anderson and Sparks (2012) estimated that 3.5 million tons of fluorite had been produced in the Kentucky portion of the IKFD. To provide an updated production figure for the entire IKFD, we extracted information from the USGS Minerals Yearbooks. Before 1910, fluorspar production figures were not extremely accurate, but we were able to obtain finished or refined tonnage estimates from Bastin (1931), Hamrick and Voskuil (1949), and Weller et al. (1952). From the sources listed, we estimated that approximately 9.4 million tons of refined fluorspar has been shipped from the Illinois portion of the IKFD. However, during the last few years of production, a few Illinois producers imported foreign fluorspar to mill and sell, which supplemented their Illinois production. Inverness Mining Company imported fluorite from Mexico from 1982 to 1985, and Ozark-Mahoning reported importing Mexican fluorspar from 1986 to 1995. In addition, some Illinois producers purchased stocks from the U.S. government strategic minerals stockpile to process and ship. The authors of the USGS Minerals Yearbooks stipulated that they had accounted for these complications in their domestic production figures. However, it is likely that after 1985, the importing and processing of foreign material and material from the U.S. strategic minerals stockpile somewhat skewed the tonnage reported from Illinois. The finished fluorspar production in Illinois from 1982 to 1995 was about 859,000 short tons, and the majority of the finished fluorspar was certainly domestic and sourced from Illinois. Reducing the estimated Illinois production attributable to imported foreign material by 400,000 tons yields a very conservative estimate of 9 million short tons of fluorspar sourced, refined, and shipped from Illinois. Combining the 9 million tons from Illinois with the 3.5 million tons of fluorite produced in the Kentucky portion (Anderson and Sparks 2012) yields 12.5 million tons.
Historically, the price of fluorspar has fluctuated with market conditions and in response to supply and demand. Below, we provide some historical figures for the price fluctuations over the years, with no attempt to equalize the dollars for inflation. From 1880 to 1916, the price of fluorspar ranged between $4.00 and $8.21 per ton (Hatmaker and Davis 1938). The price from 1926 to 1930 averaged $18.49 per ton (Hatmaker and Davis 1938). In 1931, the price of metallurgical-grade fluorspar (known as “met spar”) sold at mines in the IKFD was $15.00 per ton, but the price fell in 1932 to $9.00 per ton (Davis 1933). Acid grade is more valuable, and in 1931 it was worth $28.00 per ton but fell to $20.00 per ton in 1932 (Davis 1933). The use of fluorspar to facilitate steel production during World War II drove the price of met spar to $23.83 per ton and that of acid grade used in the manufacture of hydrofluoric acid and other fluorochemicals to $28.86 (Davis 1943). In 1964, the average price of fluorspar in the IKFD had increased to $50.62 per ton (Biggs 1966). By 1985, the price of met spar had risen to $125.00 per ton and acid grade to $165.00 to $175.00 per ton (Pelham 1987). After 1985, producers considered the price of Illinois fluorspar proprietary, and their production and sales figures were not published in the Illinois Coal Reports. However, the USGS Minerals Yearbooks indicate that in 1995 the price range for Mexican acid-grade fluorspar decreased to $115.00–$135.00 per ton and to $80.00–$105.00 per ton for metallurgical grade (Miller 1996). Recently, broad price fluctuations have not been uncommon coming from Chinese sources. The USGS Minerals Yearbooks indicated that acid-grade Mexican filter cake fluctuated between $400.00 and $550.00 in 2012 (Miller 2015). However, because of lessened global demand in 2013, prices of Chinese acid spar dropped by 21% (Miller 2015). In 2017, almost all the fluorspar consumed in the United States was imported. Mexico supplied about 72% of 2017 U.S. imports, whereas China and South Africa each supplied 9% (McRae 2017). Supply and quantities, source of the product, demand, purity or percentage of CaF2, quality of and trace elements in the fluorspar, along with geopolitical decisions have affected the recent marketable price (Table 2).
Figures
File Type: Other
Caption: Figure 1 (a) Short tons of finished fluorspar produced by year from 1880 through 1995 in the Illinois portion of the Illinois-Kentucky Fluorspar District. No significant production has occurred in Illinois since 1995. Data were extracted mainly from Illinois Coal Reports (used courtesy of Illinois Department of Natural Resources) and U.S. Geological Survey (USGS) Minerals Yearbooks (used courtesy of the USGS). (b) Average grade of ore (% CaF2) processed in the Illinois-Kentucky Fluorspar District from 1925 to 1985. Average grade was calculated by dividing the tons of finished spar reported in the USGS Minerals Yearbooks (a) by the raw tons mined, which is reported in the Illinois Coal Reports. The grade is for CaF2 only and does not take into account any credits for Pb or Zn, which would make a lower grade ore profitable, or stockpiling of ore. According to Ross Lillie, in the late 1970s, the average cutoff grade for Ozark Mahoning was typically 30% (CaF2), but if percentages of Zn, Pb, and sometimes Ba were high enough, the cutoff grade could be lowered. The red line shows that lower grade ore was being mined through time and indicates that 20% was about the lowest grade ore mined. An asterick (*) indicates a reporting error in one of the data sets for that year.
Credit: Illinois State Geological Survey
Publication: C604
Table(s)
| Table 1 Production of “raw” crude ore in Illinois by company from 1925 to 1995.1
|
| Company
|
Raw (short tons)
|
Years of production
|
| Ozark-Mahoning (OZM) and related *
|
10,239,405
|
1938-1995
|
| Minerva Oil Company, Inverness Mining Company, and Allied Chemical Company*
|
5,021,463
|
1944-1982
|
| Aluminum Ore Company (ALCOA) and related
|
1,994,109
|
1936-1965
|
| Rosiclare Lead and Fluorspar Company*
|
1,990,745
|
1925-1952
|
| Crystal Fluorspar Company
|
411,799
|
1930-1951
|
| Hillside Mines
|
310,231
|
1925-1954
|
| Illinois Minerals*
|
190,704
|
1977-1979
|
| Benzon
|
163,989
|
1925-1937
|
| Goose Creek Mining Company
|
149,839
|
1952-1958
|
| Victory Fluorspar Mining Company
|
138,281
|
1929-1945; 1952-1955
|
| Hoeb Mining Company
|
87,610
|
1956-1963
|
| G.B. Mining*
|
70,298
|
1948-1949
|
| Patton and Sons
|
60,356
|
1956-1967
|
| Fluorspar Products
|
60,078
|
1934-1947
|
| A.H. Stacey
|
53,213
|
1946-1951
|
| P.M.T. Mining
|
43,444
|
1949-1956
|
| Hastie Mining*
|
41,650
|
1969; 1973-present
|
| Mackey-Humm
|
40,088
|
1953-1956
|
| Inland Steel
|
34,363
|
1945-1948
|
| Knight, Knight, and Clark
|
23,650
|
1926-1938
|
| Crown Fluorspar Company
|
23,021
|
1942
|
| Yingling Oil Company*
|
21,557
|
1942-1948; 1951
|
|
|
| Total top producers
|
21,169,893
|
|
| Other producers
|
652,471
|
|
| Estimated total raw short tons
|
21,822,364
|
|
| 1Data extracted from Illinois Coal Reports and other sources. An asterisk (*) denotes a probable discrepancy in the data (see text for details).
|
| Table 2 Price range in U.S. dollars per metric ton of acid-grade fluorspar by year from 2010 to 2018
|
|
2010 (Table 3) |
2011 (Table 3) |
2012 (Table 3) |
2013 (Table 3) |
2014 (Table 3) |
2015 (Table 3) |
2016 (Table 3 ) |
2017 (Table 5) |
2018 (Table 4)
|
| Mexico |
260–290 |
400–450 |
400–550 |
350–550 |
290–420 |
260–310 |
260–310 |
260–310 |
260–320
|
| China |
360–380 |
550–650 |
400–600 |
310–530 |
290–370 |
260–300 |
250–270 |
260–420 |
400–530
|
Continue Reading
Circular 604 | Production History | Geology of the Illinois-Kentucky Fluorspar District | Mining Methods | Mineral Subdistricts and Individual Mines | Conclusions and Acknowledgments
References
- Evans, V.A., and D.L. Hellier, 1986, Case study: Ozark-Mahoning, sole surviving US fluorspar producer: Englewood, Colorado, Society for Mining, Metallurgy and Exploration, 3 p.
|
- Weller, J.M., 1943f, Illinois fluorspar investigations, I. Rosiclare district, D. Rosiclare Mine and vicinity: Illinois State Geological Survey, unpublished manuscript, J.M. Weller, ms. 11-D, 19 handwritten pages and 3 pls.
|
- U.S. Geological Survey (USGS), 1956, Fluorspar reserves of the United States estimated: U.S. Geological Survey and Office of Minerals Mobilization, U.S. Department of Interior Information Service, Press Release No. 23.
|
- Grogan, R.M., and J.C. Bradbury, 1968, Fluorite-zinc-lead deposits of the Illinois-Kentucky mining district, in Ridge, J.D., ed., Ore deposits of the United States: New York, AIME, p. 370–399.
|
- Trace, R.D., 1976, Illinois-Kentucky Fluorspar District, in D.R. Shawe, ed., Geology and resources of fluorine in the United States: U.S. Geological Survey, Professional Paper 933, p. 63–74.
|
- Anderson, W.H., and T.N. Sparks, 2012, Mines and minerals of the Western Kentucky Fluorspar District: Kentucky Geological Survey, Series 12, map, 1:50,000; chart 201.
|
- Bastin, E.S., 1931, The fluorspar deposits of Hardin and Pope Counties, Illinois: Illinois Geological Survey, Bulletin 58, 116 p.
|
- Hamrick, N.T., and W.H. Voskuil, 1949, Fluorspar and fluorine chemicals, Part I—Economic aspects of the fluorspar industry: Illinois State Geological Survey, Report of Investigations 141, p. 7–24 and Appendix Table 1, p. 46.
|
- Weller, J.M., R.M. Grogan, and F.E. Tippie, 1952, Geology of the fluorspar deposits of Illinois: Illinois State Geological Survey, Bulletin 76, 147 p.
|
- Anderson, W.H., and T.N. Sparks, 2012, Mines and minerals of the Western Kentucky Fluorspar District: Kentucky Geological Survey, Series 12, map, 1:50,000; chart 201.
|
- Hatmaker, P., and H.W. Davis, 1938, The fluorspar industry of the United States with special reference to the Illinois-Kentucky District: U.S. Bureau of Mines, Bulletin 59, 128 p.
|
- Davis, H.W., 1933, Fluorspar and cryolite, in O.E. Kiessling, ed., Minerals yearbook 1932–33 [year 1931–1932]: U.S. Department of Commerce, Bureau of Mines, Division of Mineral Statistics, p. 723–734.
|
- Davis, H.W., 1943, Fluorspar and cryolite, in F.M. Shore, ed., Minerals yearbook 1941: U.S. Department of the Interior, Bureau of Mines, Economics and Statistics Service, p. 1399–1416.
|
- Biggs, R.C., 1966, Fluorspar and cryolite, in W.R. Hibbard, ed., Minerals yearbook 1965, Volume I of four volumes: Metals and minerals (except fuels): U.S. Department of the Interior, Bureau of Mines, Minerals Division, p.413–426.
|
- Pelham, L., 1987, Fluorspar, in R.C. Horton, ed., Minerals yearbook 1985: Metals and minerals, Volume I: U.S. Department of the Interior, Bureau of Mines, p. 419–428.
|
- Miller, M.M., 1996, Fluorspar, in Minerals yearbook 1995: Volume 1, Metals and minerals: U.S. Department of the Interior, Bureau of Mines, 11 p.
|
- Miller, M.M., 2015, Fluorspar [advancerelease], in Minerals yearbook 2013: Metals and minerals: U.S. Department of the Interior, U.S. Geological Survey, p. 26.1–26.10.
|
- McRae, M.E., 2017, Fluorspar, in S.M.Kimball, ed., Mineral commodity summaries 2017: U.S. Department of the Interior, U.S. Geological Survey, p. 62–63.
|