File:C604 figure 001.jpg
Size of this preview: 697 × 600 pixels. Other resolution: 2,000 × 1,721 pixels.
Original file (2,000 × 1,721 pixels, file size: 961 KB, MIME type: image/jpeg)
| Mine Index(s): | 999-9999, Circular 604/Production History |
| ID Name/Number: | |
| File Type: | Other |
| Mine Company: | |
| Mine Name | |
| Date | |
| Map Scale | |
| File Credit | Illinois State Geological Survey |
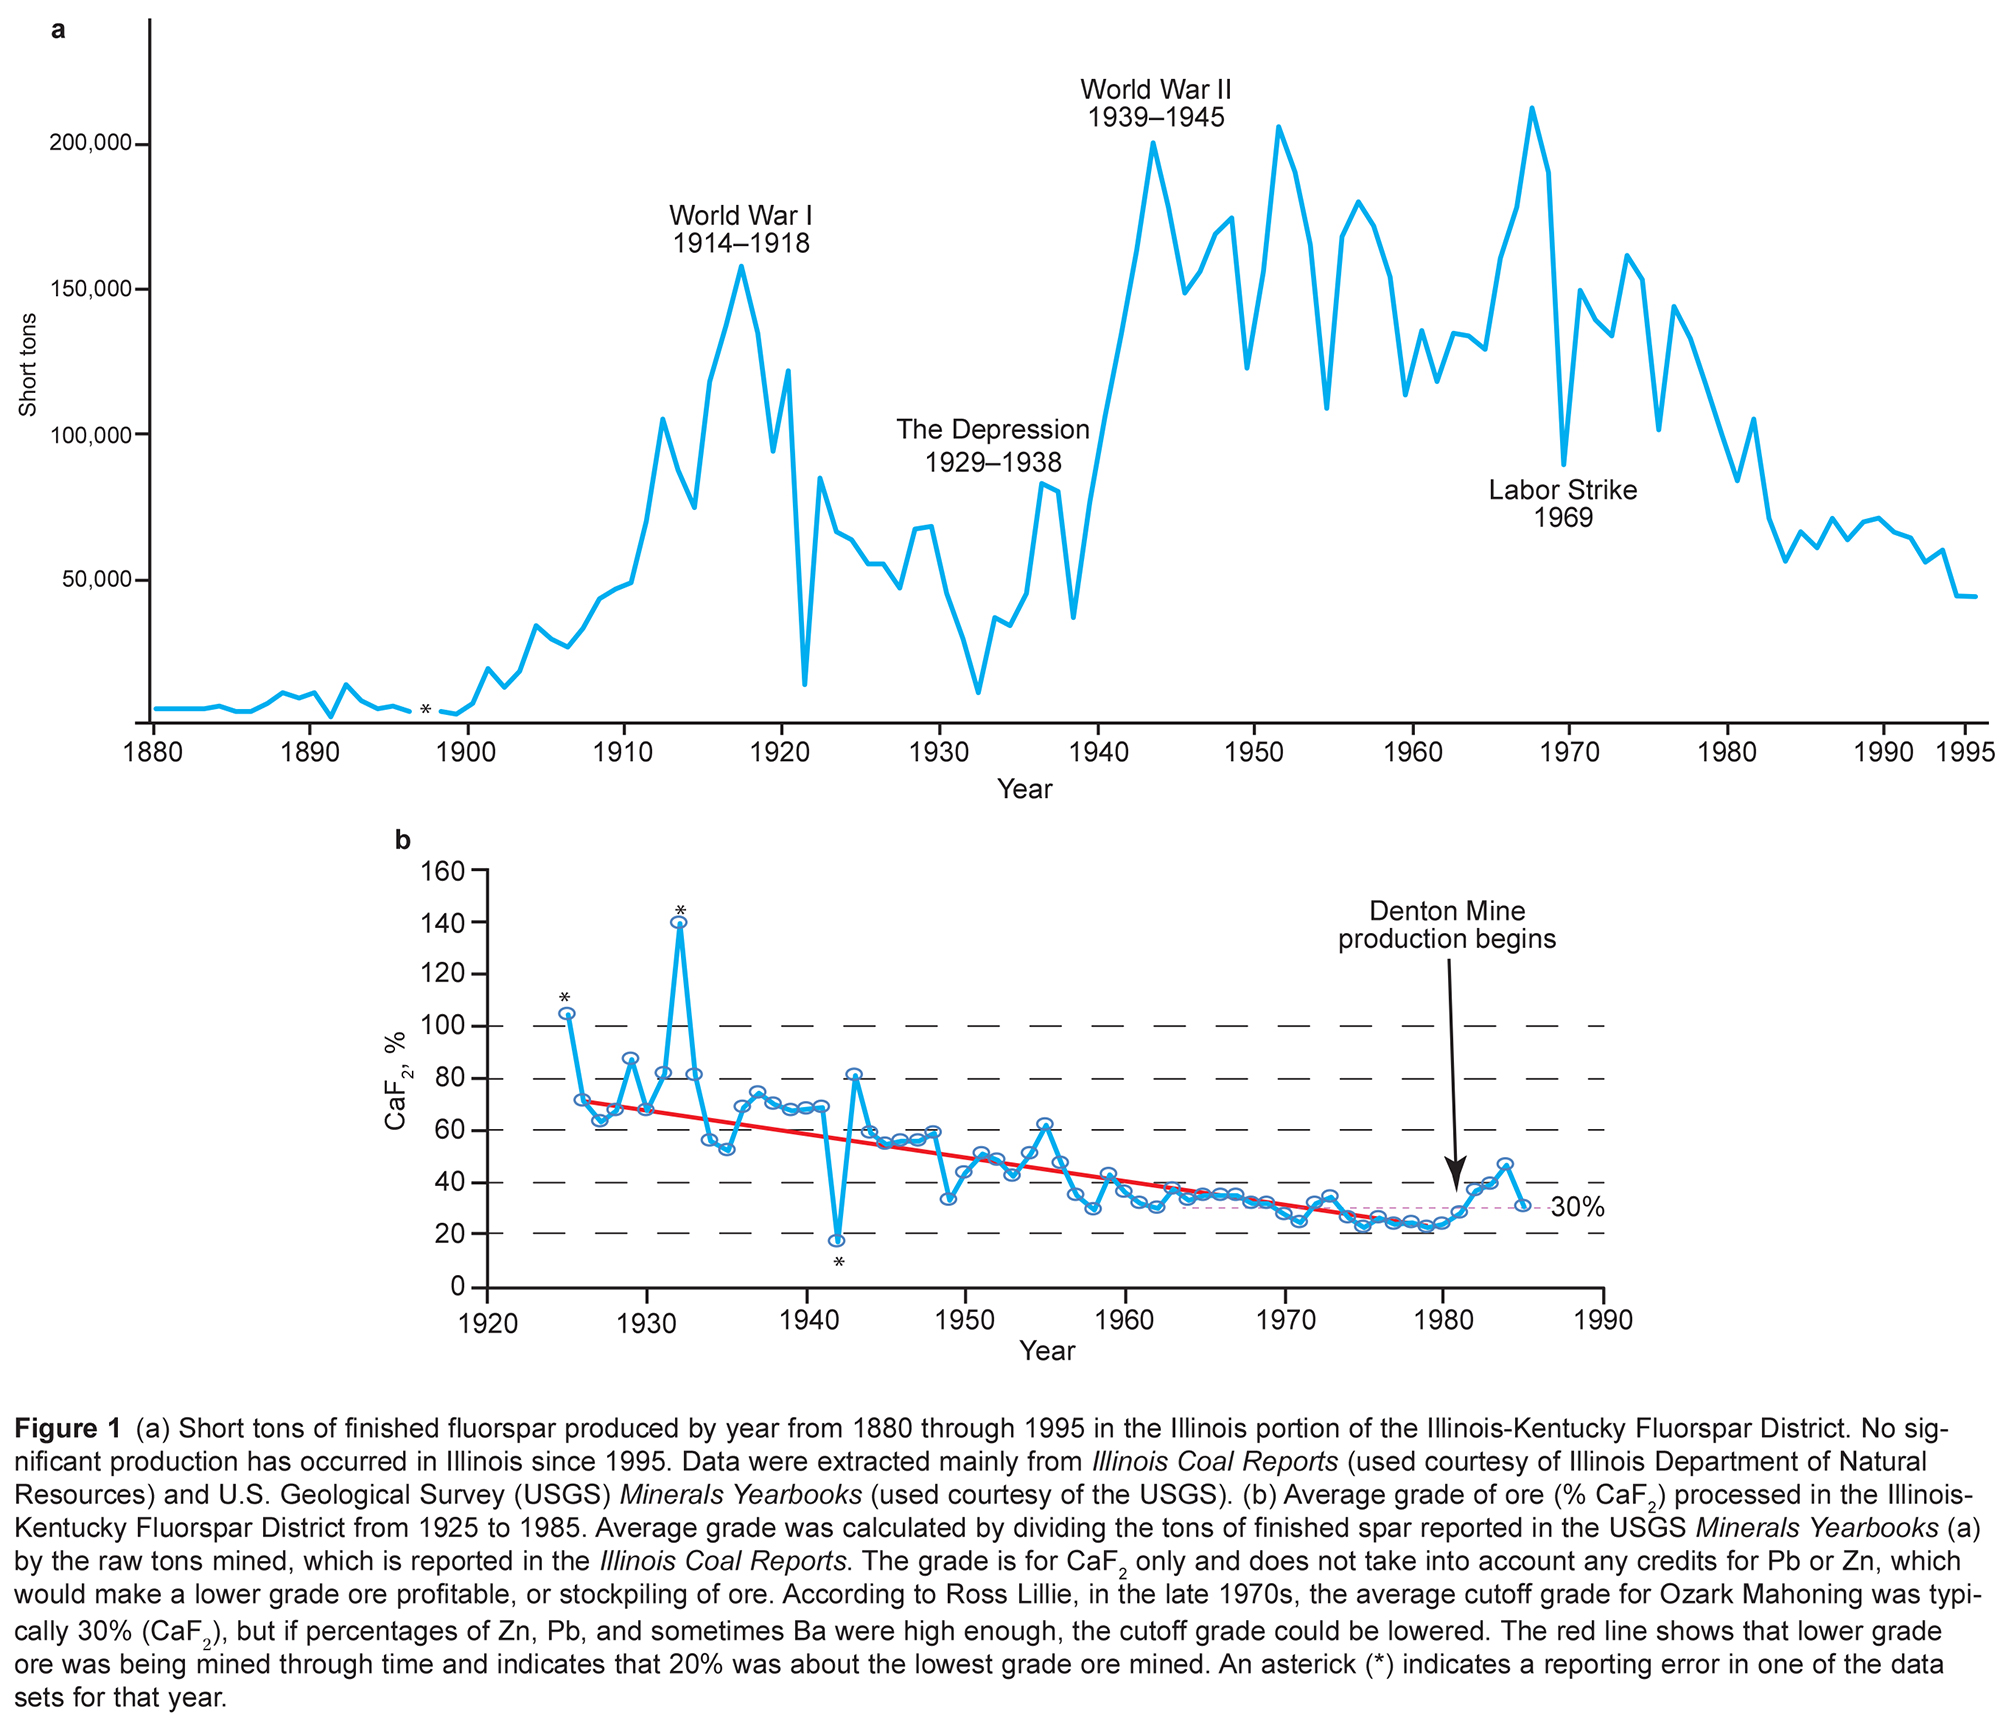
| Caption | Figure 1 (a) Short tons of finished fluorspar produced by year from 1880 through 1995 in the Illinois portion of the Illinois-Kentucky Fluorspar District. No significant production has occurred in Illinois since 1995. Data were extracted mainly from Illinois Coal Reports (used courtesy of Illinois Department of Natural Resources) and U.S. Geological Survey (USGS) Minerals Yearbooks (used courtesy of the USGS). (b) Average grade of ore (% CaF2) processed in the Illinois-Kentucky Fluorspar District from 1925 to 1985. Average grade was calculated by dividing the tons of finished spar reported in the USGS Minerals Yearbooks (a) by the raw tons mined, which is reported in the Illinois Coal Reports. The grade is for CaF2 only and does not take into account any credits for Pb or Zn, which would make a lower grade ore profitable, or stockpiling of ore. According to Ross Lillie, in the late 1970s, the average cutoff grade for Ozark Mahoning was typically 30% (CaF2), but if percentages of Zn, Pb, and sometimes Ba were high enough, the cutoff grade could be lowered. The red line shows that lower grade ore was being mined through time and indicates that 20% was about the lowest grade ore mined. An asterick (*) indicates a reporting error in one of the data sets for that year. |
| Publication | C604 |
File history
Click on a date/time to view the file as it appeared at that time.
| Date/Time | Thumbnail | Dimensions | User | Comment | |
|---|---|---|---|---|---|
| current | 09:21, June 2, 2021 | | 2,000 × 1,721 (961 KB) | Alan.Myers (talk | contribs) |
You cannot overwrite this file.
File usage
The following page uses this file: